
The EQ Platform
Waveform-Grounded Intelligence at the Edge
Energy Quotient protects equipment and production, reduces downtime, and lowers energy costs by closing the intelligence gap in power systems. Traditional tools offer fragmented monitoring and delayed alerts. The EQ platform delivers continuous visibility, real-time diagnostics, physics-grounded AI insight, and decisive action for facilities where safety and uptime are critical, or where energy costs run high.
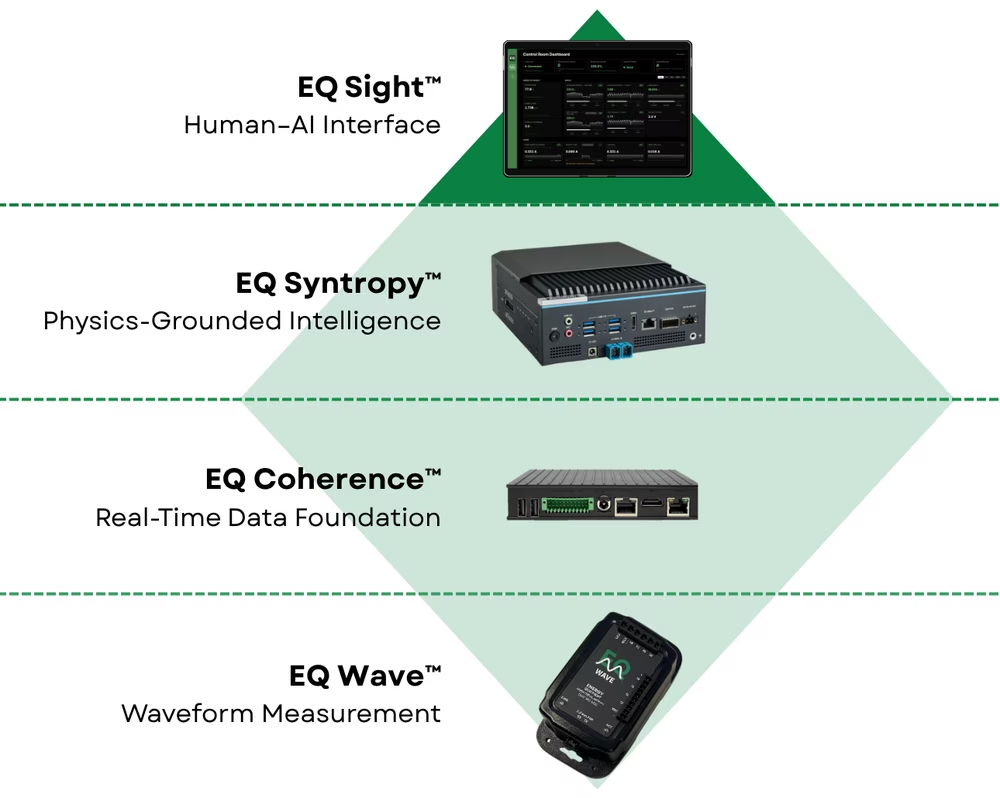
The platform rests on three cornerstone products. EQ Wave™ samples every voltage and current channel 32,000 times a second, continuously. EQ Coherence™ records and processes each device’s data in real time, gap-free and on your premises, in modular pipelines that run your processing alongside ours. EQ Syntropy™ is the platform’s intelligence: it reasons across every device, from the live waveform stream and weeks of full-resolution history, to find precursors, correlations, and root causes, and writes new analysis when a question calls for it. EQ Sight™ provides a consistent user interface across the platform, from live waveforms to AI-guided diagnostics.
Together, they capture, store, and examine everything that happens to your equipment, down to the sub-millisecond, and detect the smallest anomalies in power and performance before they cause trouble.
Built for Modern Power Systems
Power systems are changing rapidly: loads are nonlinear and dynamic, renewables add variability, and growing demand, from AI data centers to EV charging, pushes infrastructure to its limits. At the same time, more equipment depends on clean power, and a disturbance lasting a fraction of a cycle can trip it, reset it, or damage it. Most power quality tools were built for a simpler era: they report averages and aggregates, or capture waveforms only when a trigger fires. Our comparison of CPOW with triggered power quality meters sets out what each one records.
The EQ platform starts from continuous, high-resolution waveform capture, paired with context: equipment state, environmental conditions, and facility logs. Recording, AI, and control all work from that same measured record. That makes the platform a real-time intelligence layer for your power system, not another monitoring tool. It also replaces the separate power meter, power quality analyzer, and historian: power monitoring, power quality, and energy share one record, in place from commissioning day.
AI-Guided Diagnostics
AI-guided diagnostics built on continuous waveform data. Physics-grounded, explainable, with human oversight. EQ Syntropy runs deterministic signal processing and standards engines on the record, explains the results in plain language with every value cited to its measurement, and leaves the decision to your engineers. It runs on EQ-hosted servers or on your own edge AI hardware, and the language model is your choice of a frontier model or a self-hosted open-weight one; with a self-hosted model, the whole system runs on premises.
Capabilities
Your data is yours. Every gateway gives you the waveform and metrics streams, its REST and WebSocket APIs, Modbus TCP and MQTT, and our open-source Python toolkit, at full rate and full resolution, free to use. Further capabilities build on the same foundation you already run:
- Remote access: EQ Sight from anywhere, live waveforms included, at your site’s own secure address, with sign-in restricted to your team.
- Advanced analysis: standards checks and compliance reporting against IEEE 519, SEMI F47, and the ITIC curve.
- Specialized protocols: DNP3 for utility SCADA, BACnet for building automation, and OPC UA for manufacturing systems, available on request.
- Power line communication: decodes communication signals carried on the power line, configured to your signaling scheme, on the same gateway and alongside continuous waveform capture.
- Waveform-grounded control: checks every command against real-time electrical conditions and carries out only what the system can safely support, from advisory recommendations to protective action through dedicated hardware.
- Power as a security sensor: shows what the equipment on each monitored circuit is actually drawing, physical evidence far harder to falsify than software telemetry.
- OEM integration: your product built on the platform at board, sensor firmware, gateway, or interface level, with live CPOW linked into your own software through a C interface.
Responsible by Design
Your data stays on your premises and under your control. Analysis is physics-grounded, engineers decide on every safety-critical action, and every conclusion traces to the waveform evidence behind it, with each analysis recorded for audit. Our commitments are in Responsible Use; how the platform is secured is in A Protocol Is Not a Security Posture.
What Your Team Gains
- Engineers find root cause in the waveform itself, in minutes, instead of piecing it together from handoffs and guesswork.
- Maintenance teams add electrical signatures to their predictive maintenance: they see equipment start to degrade, fix it before it fails, and confirm the fix in the record.
- Facility managers track the KPIs that matter and ask the AI why they moved and what to do next, so they decide with evidence, not a vendor’s best guess.
- Operators get alerts tied to what the power system actually did, so they act on real events, not noise.
- Energy managers find where to cut energy use without putting equipment or operations at risk.
- Quality and compliance leads prepare audits faster, with AI-generated reports and timestamped waveform plots.
Investigations that took hours of specialist effort, moving between devices, spreadsheets, and vendor reports, now start in seconds from one continuous record.
Follow the steps from installation to a root cause, and see how the platform applies to your sector. See it first in The Control Room, or start with a pilot at your site.
Book a demo
Already have access? Sign in at demo.eq.systems.