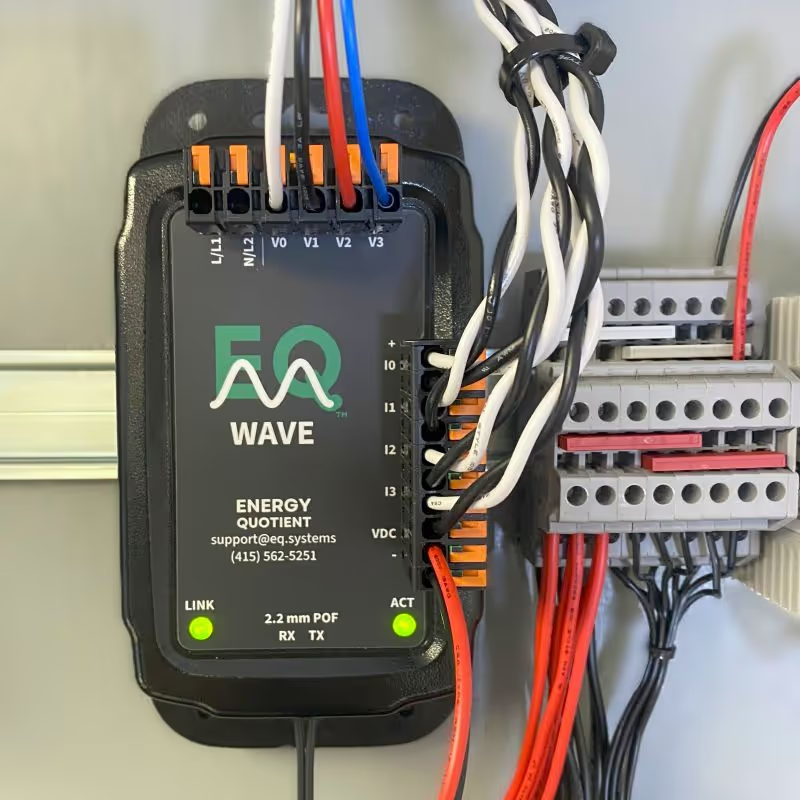
Energy Quotient builds real-time intelligence for the physical world, starting with critical power systems. Physics-grounded AI reads a complete, continuous record of the electrical waveform and turns it into insight your team can act on.
They now cause failures that are costly and often hard to predict, diagnose, and prevent.
The risk now reaches from homes to fabs: households near data center clusters measure more distorted power (Bloomberg, 2024), and a 30-minute power outage cost one memory fab about $43 million in 2018 (TheElec).
The platform is software that runs on your premises.
Try It Yourself
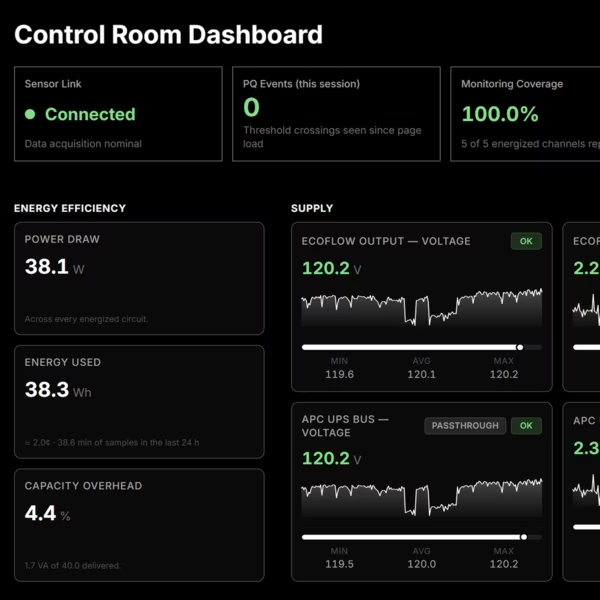
The Control Room runs the full platform on our lab power system, and you operate it from your browser: start a motor, change its supply, and watch the measured waveform and spectrum respond.
How This System Is Different
Conventional tools only sample, average, or wait for a trigger. We deliver power system insight you can trust, built on four principles:
Continuous, Full-Fidelity Waveform Data
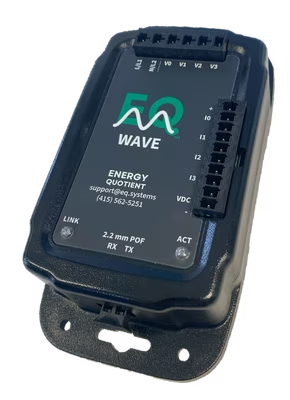
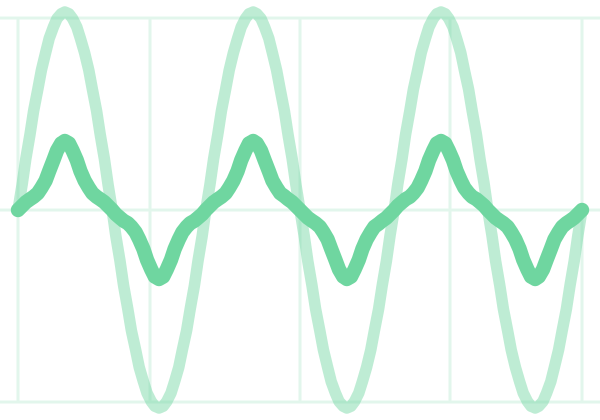
EQ Wave™ captures complete waveforms continuously, as Continuous Point-on-Wave (CPOW) data rather than averages and aggregates, preserving the harmonics, timing distortion, and sub-cycle events that other systems miss.
Physics-Grounded AI
Deterministic signal processing and power-system analysis establish what the measurements show; AI interprets them in operating context and cites its evidence, for explainable root-cause insight in real time.
Edge-First Intelligence
Intelligence runs at your edge, and your data stays inside your trust boundary. The same architecture runs diagnostics air-gapped, on premises, or in the cloud.
Infrastructure You Own
Your waveforms, power quality metrics, and visualization are yours, free to use. Advanced AI analysis and expert monitoring are there when you need deeper insight.
Proven in the Field
220k+
data points per second continuously streamed
< 10 ms
end-to-end latency under one AC cycle
12T+
points of gap-free data recorded to date
Semiconductor Fabs
Energy Quotient has run proofs-of-concept in multiple fabs.
Industrial Floor
The platform recorded continuously for seven months in a working shop at Humanmade in San Francisco.
Defense Experimentation
At JIFX 26-3, the platform characterized a U.S. Army-owned re:3D industrial printer using one sensor on its supply and fed live data into KBR's COPERS for US Army Pacific. Read the report.
Analysis for Your Team
For Facility Managers
Track the KPIs that matter and ask the AI why they moved, so you decide with evidence.
For Energy Managers
Use one platform to track power quality, demand, and efficiency so you can cut waste without adding risk.
For Maintenance Teams
See waveform-level behavior, confirm fixes, and schedule work before small issues become failures.
For Engineers
Find root cause from full-resolution waveform data in minutes, without losing big-picture context.
Questions
What is Continuous Point-on-Wave (CPOW) monitoring?
CPOW monitoring records every sample of the voltage and current waveforms around the clock, not averages or short windows around a trigger. EQ Wave records 32,000 samples per second per channel, so any disturbance can be found and examined after the fact.
Is Energy Quotient event-triggered?
No. Every cycle is kept, and events are detected on that full record instead of deciding what gets recorded, so a disturbance just under a threshold is still there to find.
How is AI used?
EQ Syntropy™ is an AI analyst for your power system. Ask in plain language about any circuit and any moment on record: it retrieves the waveforms in under a second, runs signal processing and standards engines on them, writes its own analysis when needed, and finds past events with similar waveforms. It also watches every circuit for changes in condition. Every answer cites its measurements, and your engineers decide what to act on.
Does it need a cloud connection?
No. EQ Coherence™ records and serves the full-resolution waveform history on a gateway at your site, and EQ Sight™ opens it in a browser. EQ Syntropy runs on EQ-hosted servers or on your own GPU hardware on site; with a self-hosted model, the whole system runs on premises, including air-gapped. Remote access and cloud sync are optional.
How is CPOW different from a power quality meter?
A power quality meter summarizes and alarms; a CPOW installation keeps the evidence. It monitors around the clock like a meter, in more detail than a portable survey, so when equipment trips, the waveform before, during, and after is already on record. See the comparison.
Where It Leads
We start with critical power because that is where the pressure is highest today. Energy is the common denominator of every physical system, so the same signal-level, physics-grounded reasoning extends to every sensor and control loop that measures one: mechanical, thermal, and chemical as well as electrical.