
EQ Sight
EQ Sight™ puts everything your power system does in front of the people who run it. It is the user interface across the Energy Quotient™ platform, in the browser: EQ Coherence™ supplies each device’s data, and EQ Syntropy™ adds the reasoning across devices. Every EQ Coherence installation includes it: live instruments, events, and history from monthly trends down to a single cycle, all on the continuous waveform record from EQ Wave™.
EQ Sight is a dashboard and a diagnostic environment in one: it shows your whole facility at a glance, and every view leads down to the measured signal, so the answer to “what happened?” is already recorded.
The Challenge
Power quality data is hard to interpret. Traditional tools present walls of numbers and waveforms that only a specialist can read, and they often hold no record of the moment that mattered. Facilities need direct answers: What caused that trip? Is this equipment degrading? How do we prevent it next time?
EQ Sight answers them from a complete record, in views each member of the team can use.
See the Whole Facility
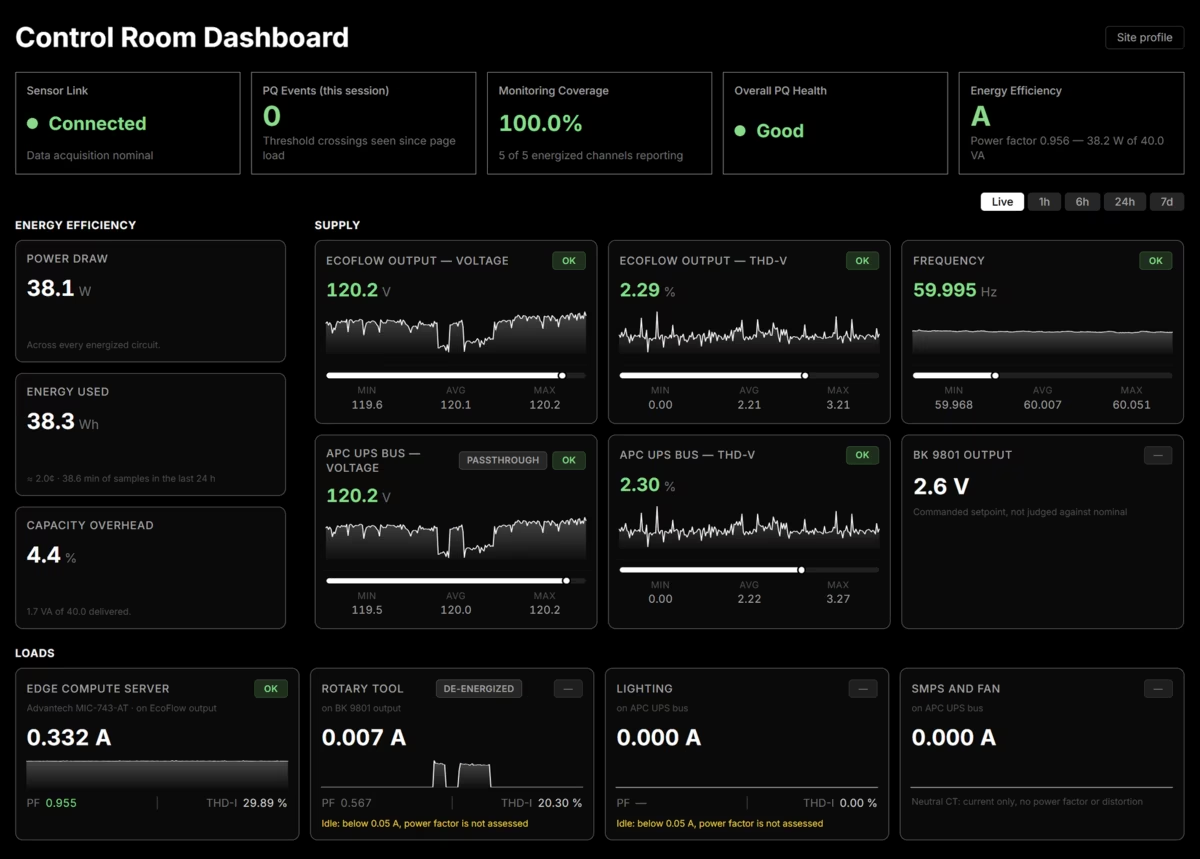
The dashboard puts the whole facility on one screen, live or over the last hour, day, or week:
- Status at a glance: sensor link, power quality health, monitoring coverage, threshold crossings, and an energy-efficiency grade.
- Supply: voltage, voltage distortion, and frequency for every source, each judged against its nominal, with minimum, average, and maximum.
- Loads: current, power factor, and current distortion for every circuit, with its state: energized, idle, or de-energized.
- Energy: power draw, energy used, and capacity overhead across every energized circuit.
Go From Trends to a Single Cycle
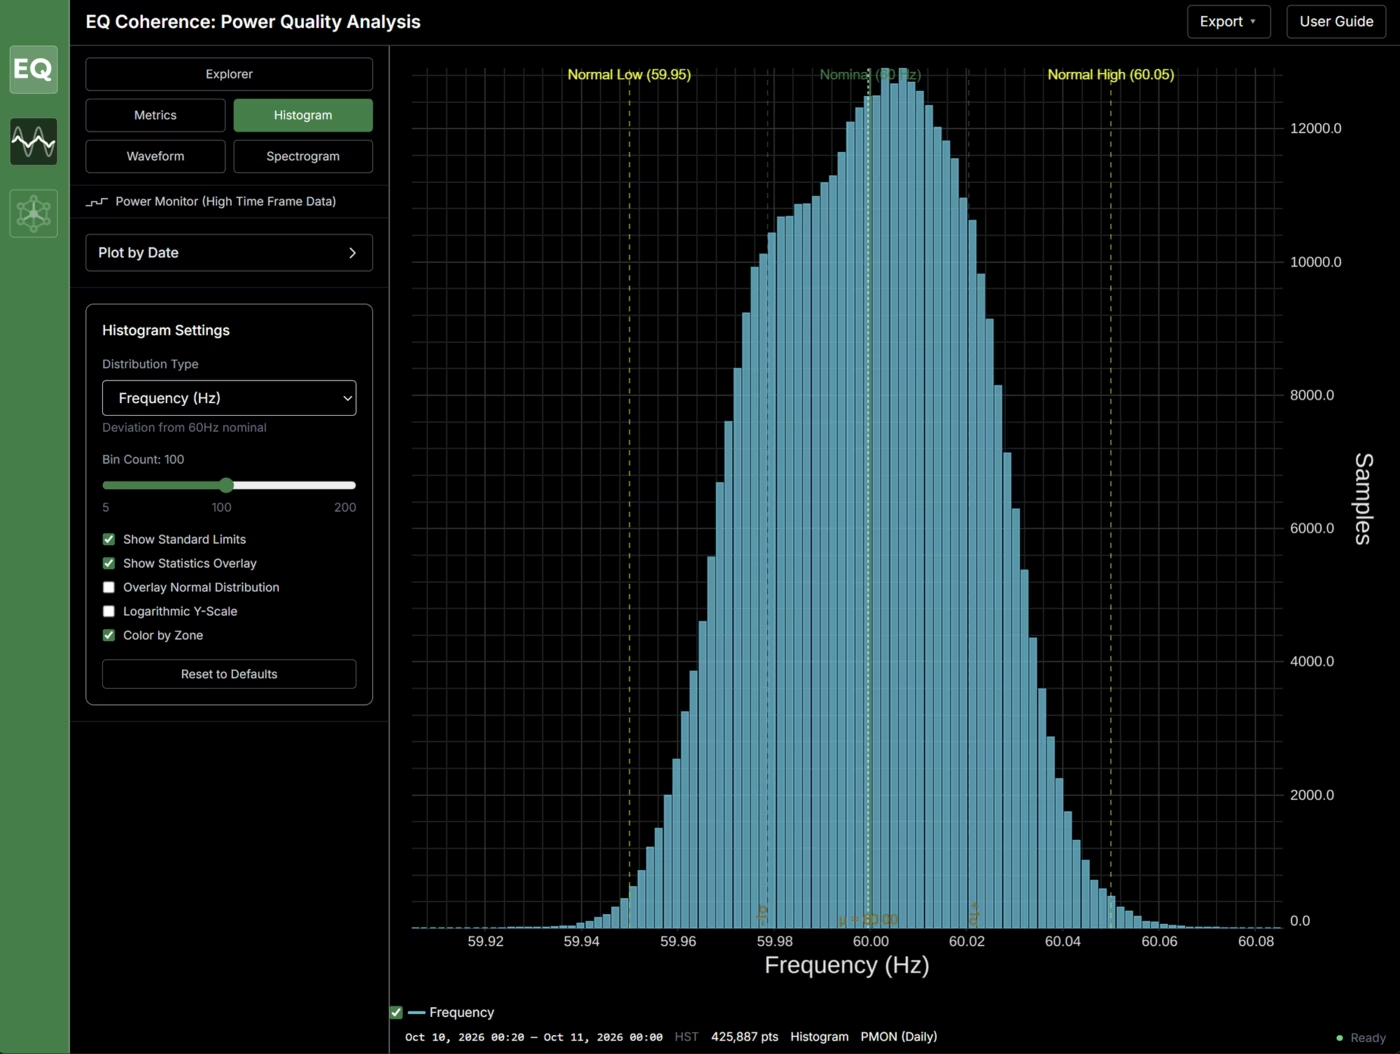
Every device has a history view that plots metrics (RMS voltage and current, power, power factor, frequency, THD) and the raw Continuous Point-on-Wave (CPOW) data at 32 ksps from the same record. Pick any moment in the stored history, even weeks back, and zoom from the trend down to individual cycles, with no capture to request and no tool to switch. Histograms show how any metric is distributed over a period, for example a full day of grid frequency against its normal band.
Live Instruments
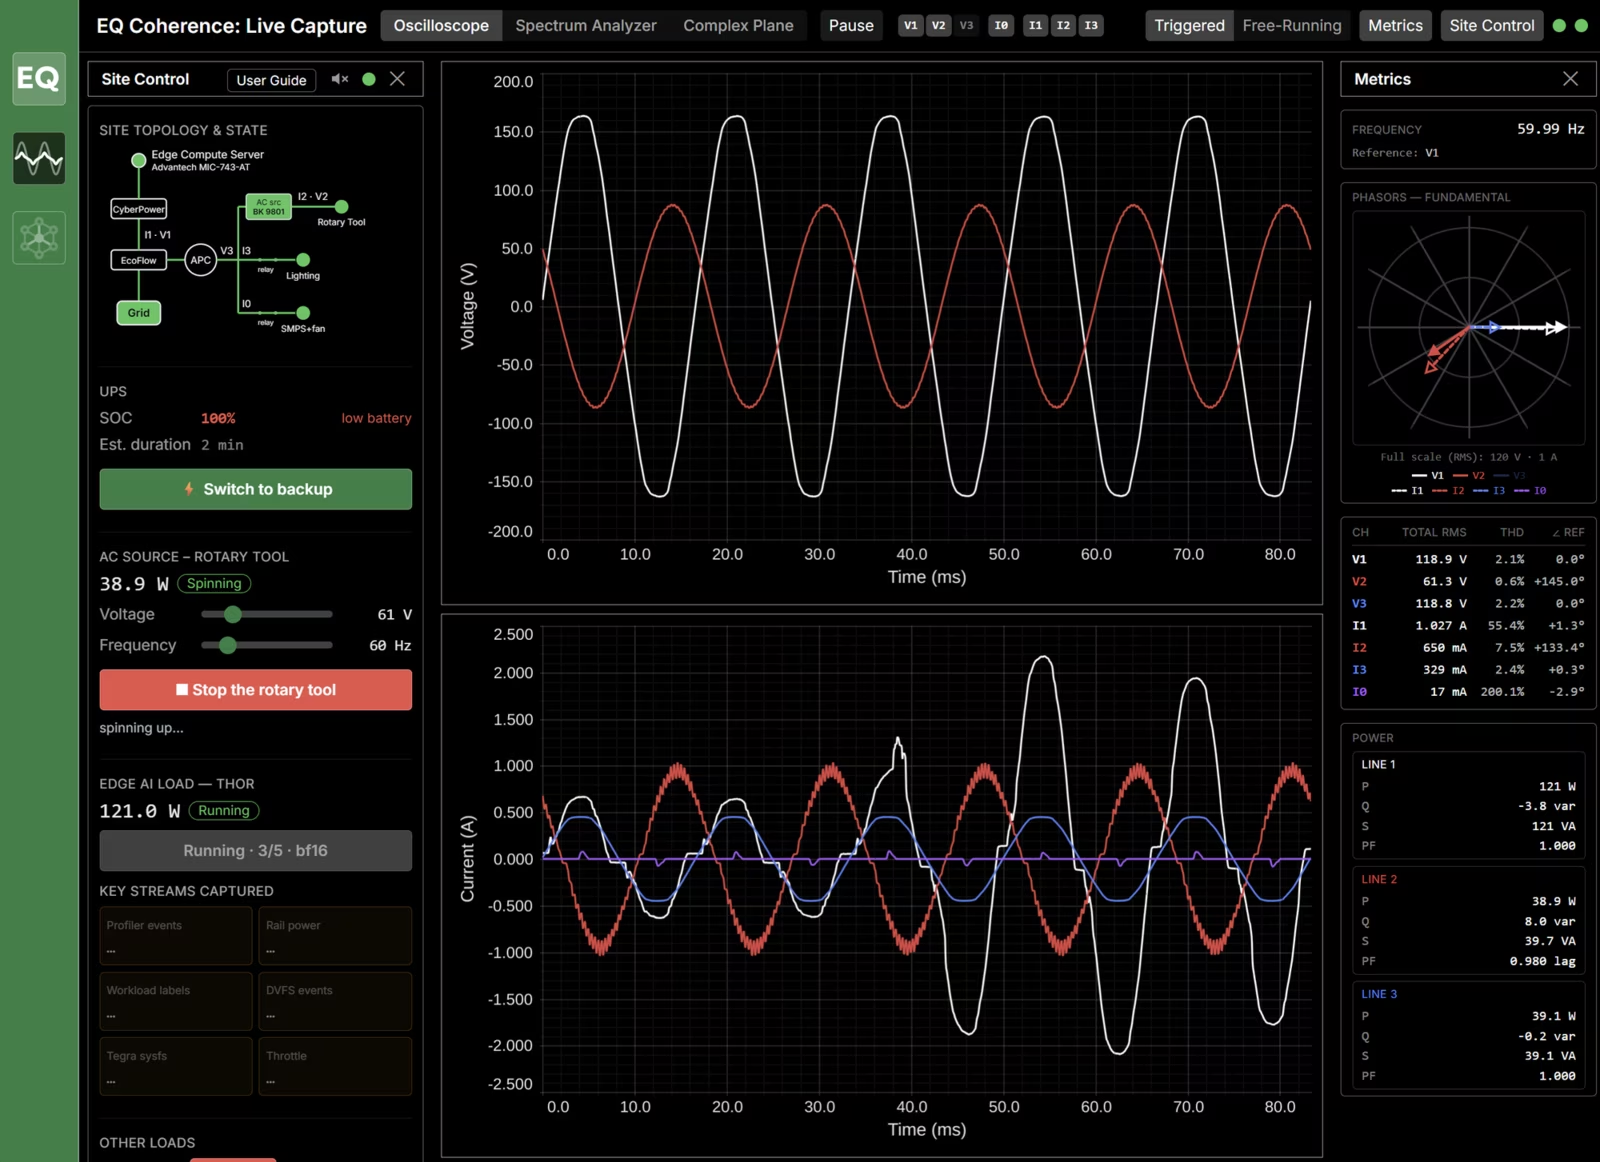
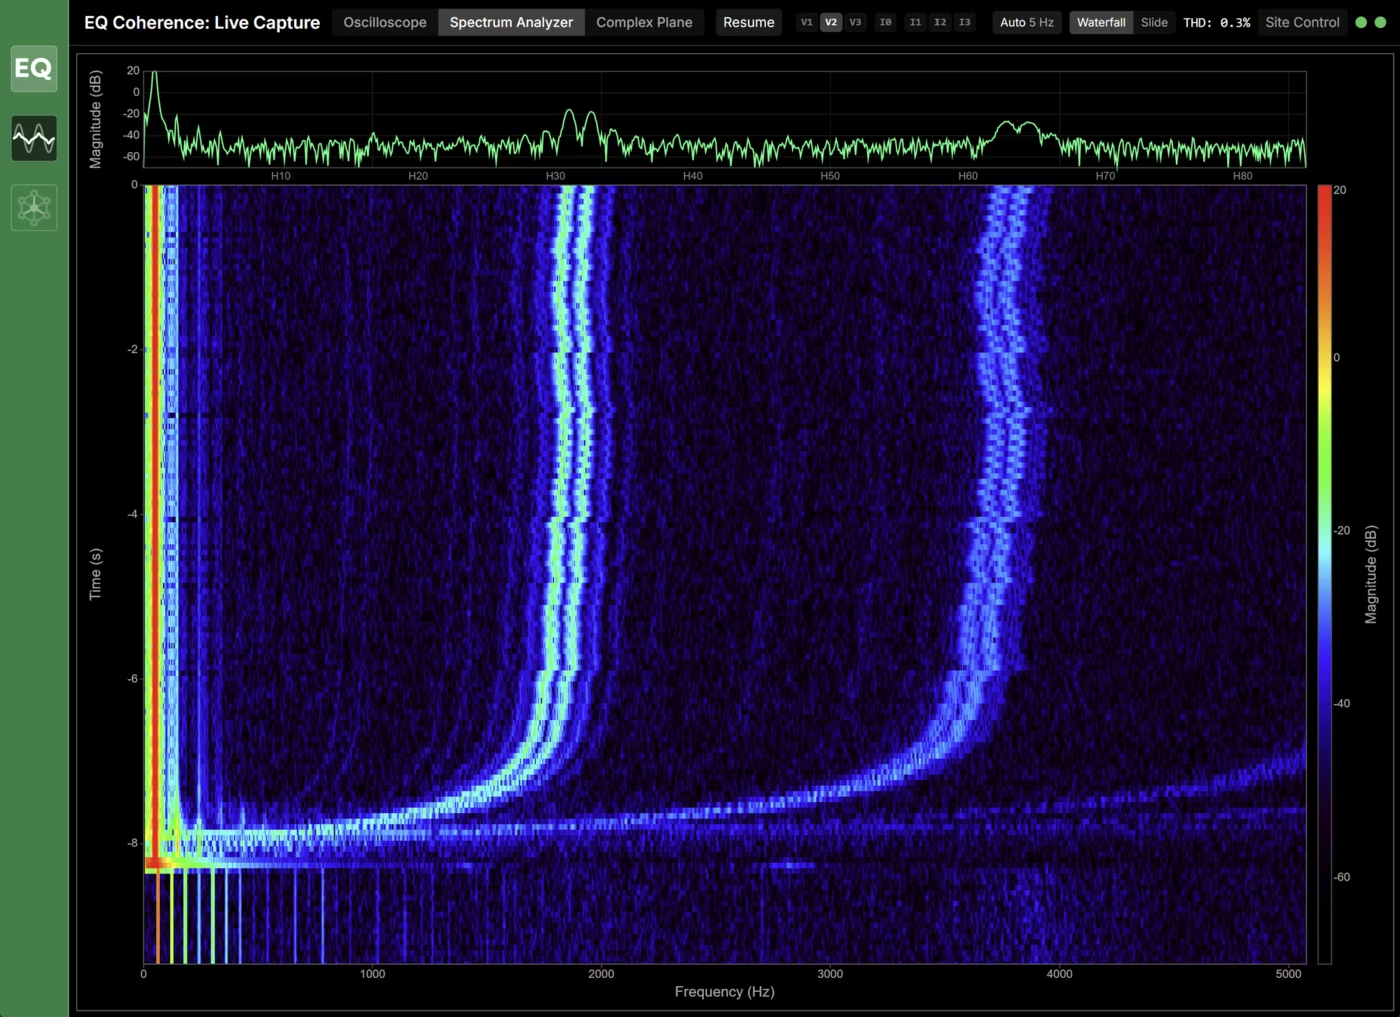
EQ Sight streams live waveforms from EQ Wave into the browser:
- Oscilloscope: three-phase voltage and current, triggered on zero crossings for a stable view or free-running, with a frequency readout accurate to a fraction of a hertz.
- Spectrum analyzer: a rolling spectrogram up to 8 kHz with a live spectrum and THD readout, resolving harmonics and interharmonics to about 1 Hz.
Analysis on Your Terms
- JupyterLab: a Python environment with our open-source equser toolkit and sample notebooks, for custom calculations, visualizations, and exports on the full-resolution data. Included with the EQ Lab Gateway.
- AI investigation: with EQ Syntropy, ask questions in plain language across every device. It runs the analyses, computes custom KPIs and plots on demand, drafts reports with you, and answers with every value cited to the measurement it came from.
For Every Role
- Facility managers see facility status, power quality health, and efficiency at a glance, without reading a waveform.
- Maintenance teams see what critical equipment actually experienced, and verify fixes with before-and-after records.
- Engineers get full waveform access, live instruments, and the full-resolution data for their own tools.
- Operators see live status and every threshold crossing, so they act on what the power system actually did.
- Energy managers see energy use, power draw, and efficiency on the dashboard, beside the power quality that cutting energy use could put at risk.
Access and Security
EQ Sight runs in the browser, with nothing to install, on anything from an engineering workstation to a control room’s multi-pane displays.
- Local access, standard: directly from the gateway on your facility network, including on isolated networks with no internet connection.
- Remote access, optional: at your site’s own secure address (for example,
your-site.pq.app), with TLS encryption and sign-in restricted to your team through our single sign-on.
See EQ Sight in the Control Room
Book a session and explore live waveform data from our lab, with an engineer to answer questions.